Available results for: hiv, syphilis, ct, gc Small Area Estimation and Hotspot Analysis
Bayesian spatial modeling for HIV, Syphilis, Chlamydia, and Gonorrhea in the Southeast United States
Keywords
sexually transmitted infections, STI, STD, syphilis, epidemiology, public health, Southeast United States, surveillance, trends, spatial analysis, Bayesian modeling, small area estimation
Bayesian Areal Data Models and Hotspot Analysis
This analysis uses Bayesian areal data models to identify spatial hotspots for sexually transmitted infections (STIs) in the Southeast United States. Small area estimation techniques allow us to identify counties where disease rates are elevated beyond what would be expected from population size alone, accounting for spatial autocorrelation. See the Methods page for more details.
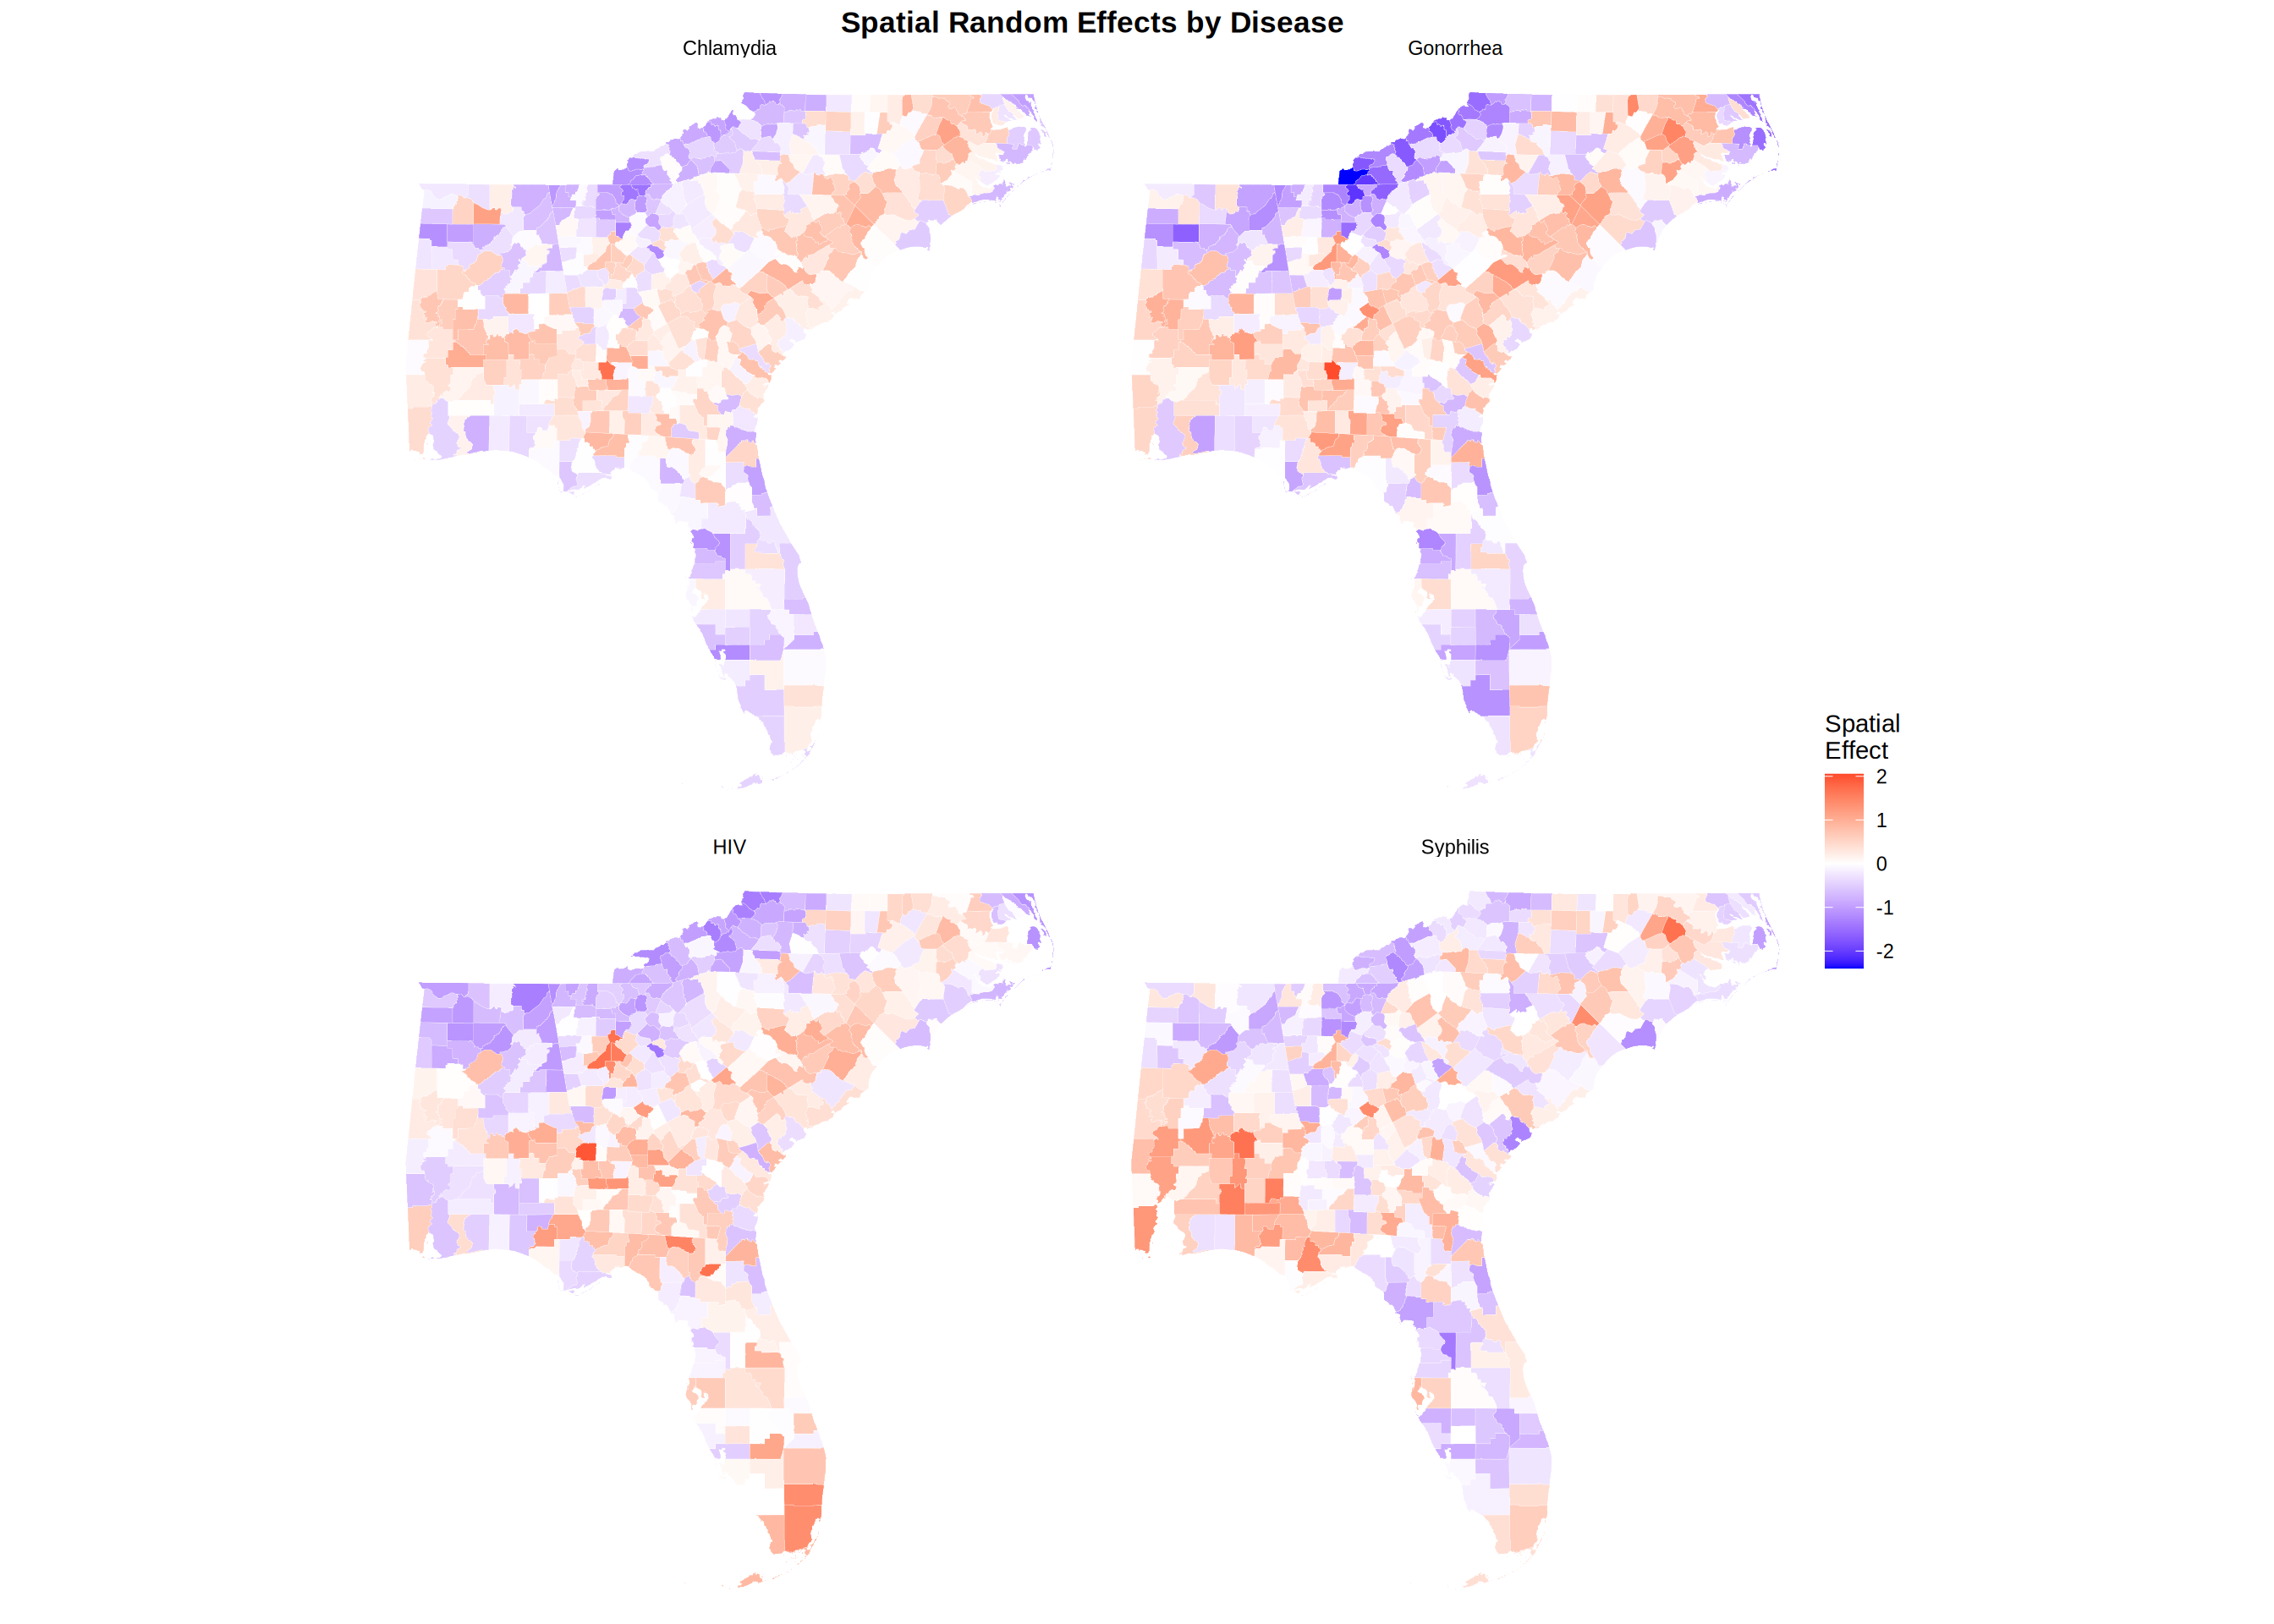
For each sexually transmitted infection, we examine the county-level spatial effect to determine if there are any counties with elevated disease rates that are not explained by population size alone and spatial correlation indicating a potential hotspot.
HIV Prevalence
Below are maps of the observed rate, spatial effect, and identified hotspots for HIV prevalence in 2023.
Summary Statistics
Observed Rates:
- Mean: 380.18 per 100,000
- Median: 309.20 per 100,000
- Range: 62.60 - 2380.90 per 100,000
Spatial Effects: - Mean: 0.0025 - Std Dev: 0.6146 - Range: -1.4057 - 1.9546
Hotspots: - Number: 44 (10.1% of counties) - Threshold: 0.7721
Primary and Secondary Syphilis
Summary Statistics
Observed Rates: - Mean: 18.07 per 100,000 - Median: 14.10 per 100,000 - Range: 0.00 - 103.80 per 100,000
Spatial Effects: - Mean: 0.0013 - Std Dev: 0.5608 - Range: -1.3755 - 1.7046
Hotspots: - Number: 44 (10.0% of counties) - Threshold: 0.7540
Chlamydia (CT)
Summary Statistics
Observed Rates: - Mean: 554.09 per 100,000 - Median: 494.60 per 100,000 - Range: 92.10 - 2730.00 per 100,000
Spatial Effects: - Mean: 0.0014 - Std Dev: 0.5332 - Range: -1.4538 - 1.7025
Hotspots: - Number: 44 (10.0% of counties) - Threshold: 0.6824
Gonorrhea (GC)
Summary Statistics
Observed Rates: - Mean: 205.61 per 100,000 - Median: 172.60 per 100,000 - Range: 0.00 - 1342.10 per 100,000
Spatial Effects: - Mean: 0.0020 - Std Dev: 0.7007 - Range: -2.3950 - 2.0507
Hotspots: - Number: 44 (10.0% of counties) - Threshold: 0.8520
Comparison Across Diseases
Spatial random effects represent deviations from the overall mean rate that cannot be explained by population size alone. Positive spatial effects indicate areas with elevated disease rates after accounting for population, while negative effects indicate lower-than-expected rates.
Table: Hotspot Summary by Disease

|Disease   | Counties| Hotspots| % Hotspots| Mean Rate| Mean Spatial Effect|
|:---------|--------:|--------:|----------:|---------:|-------------------:|
|Chlamydia |      439|       44|       10.0|     554.1|              0.0014|
|Gonorrhea |      439|       44|       10.0|     205.6|              0.0020|
|HIV       |      437|       44|       10.1|     380.2|              0.0025|
|Syphilis  |      439|       44|       10.0|      18.1|              0.0013|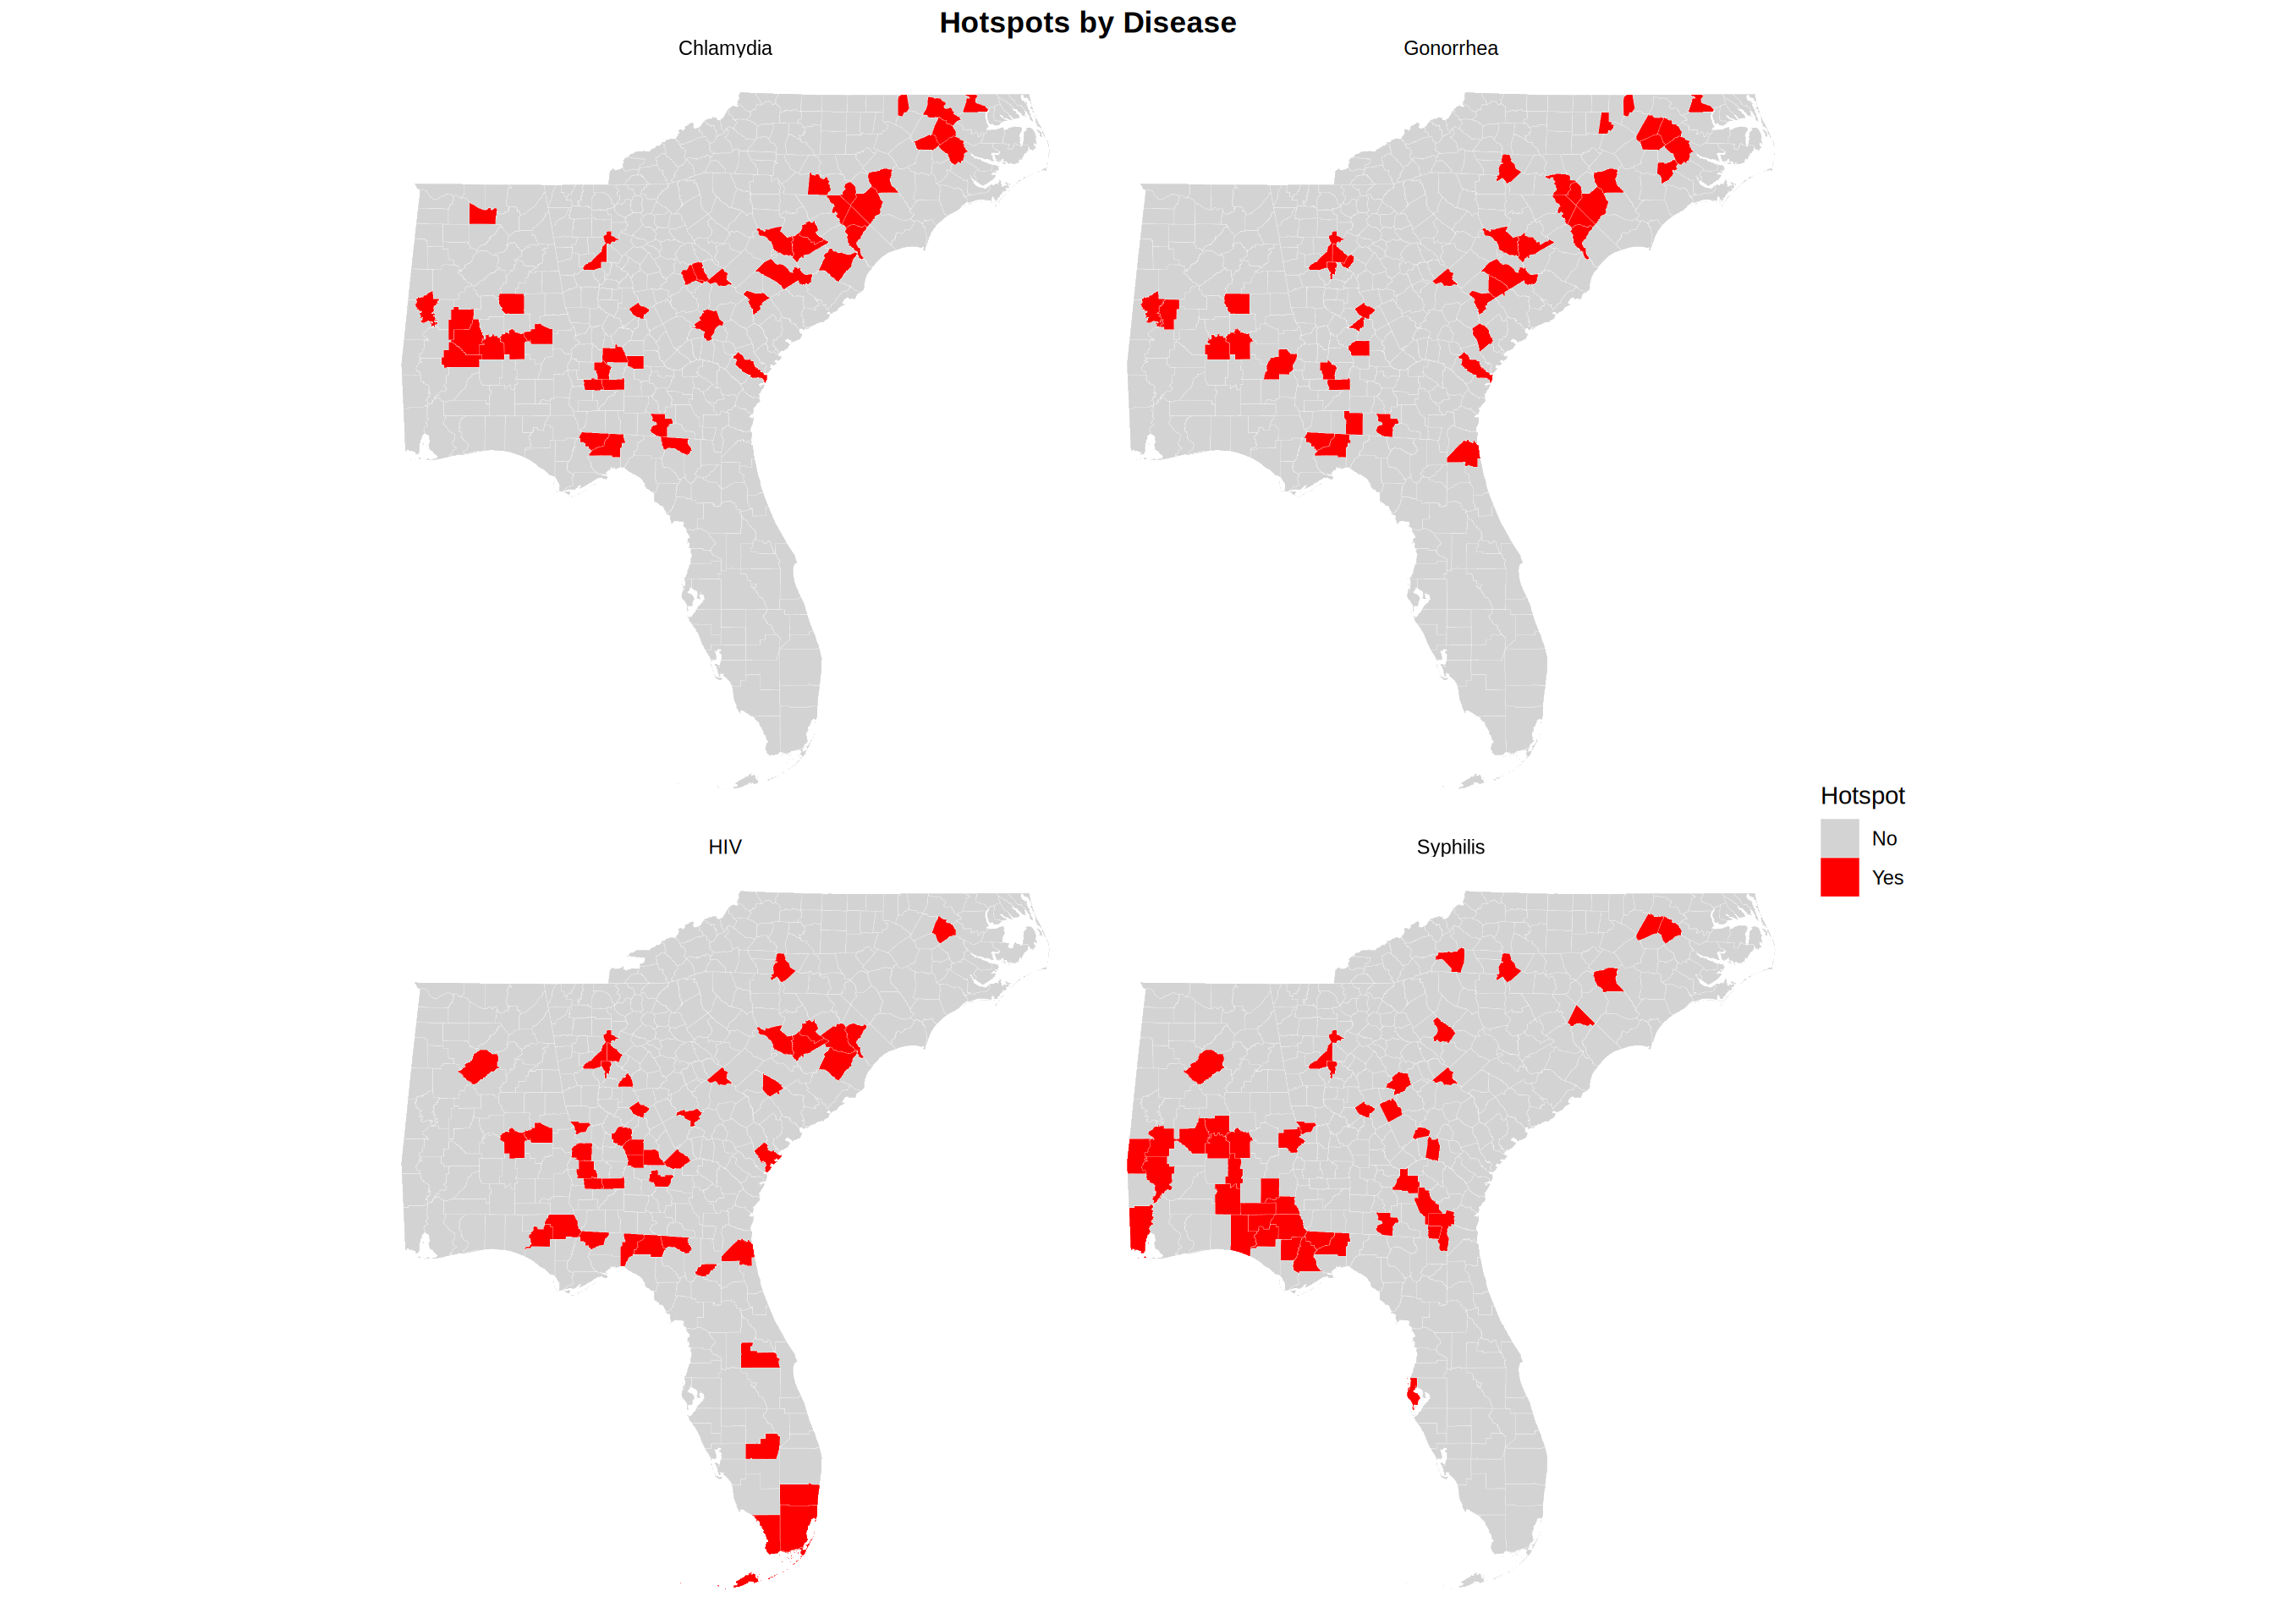
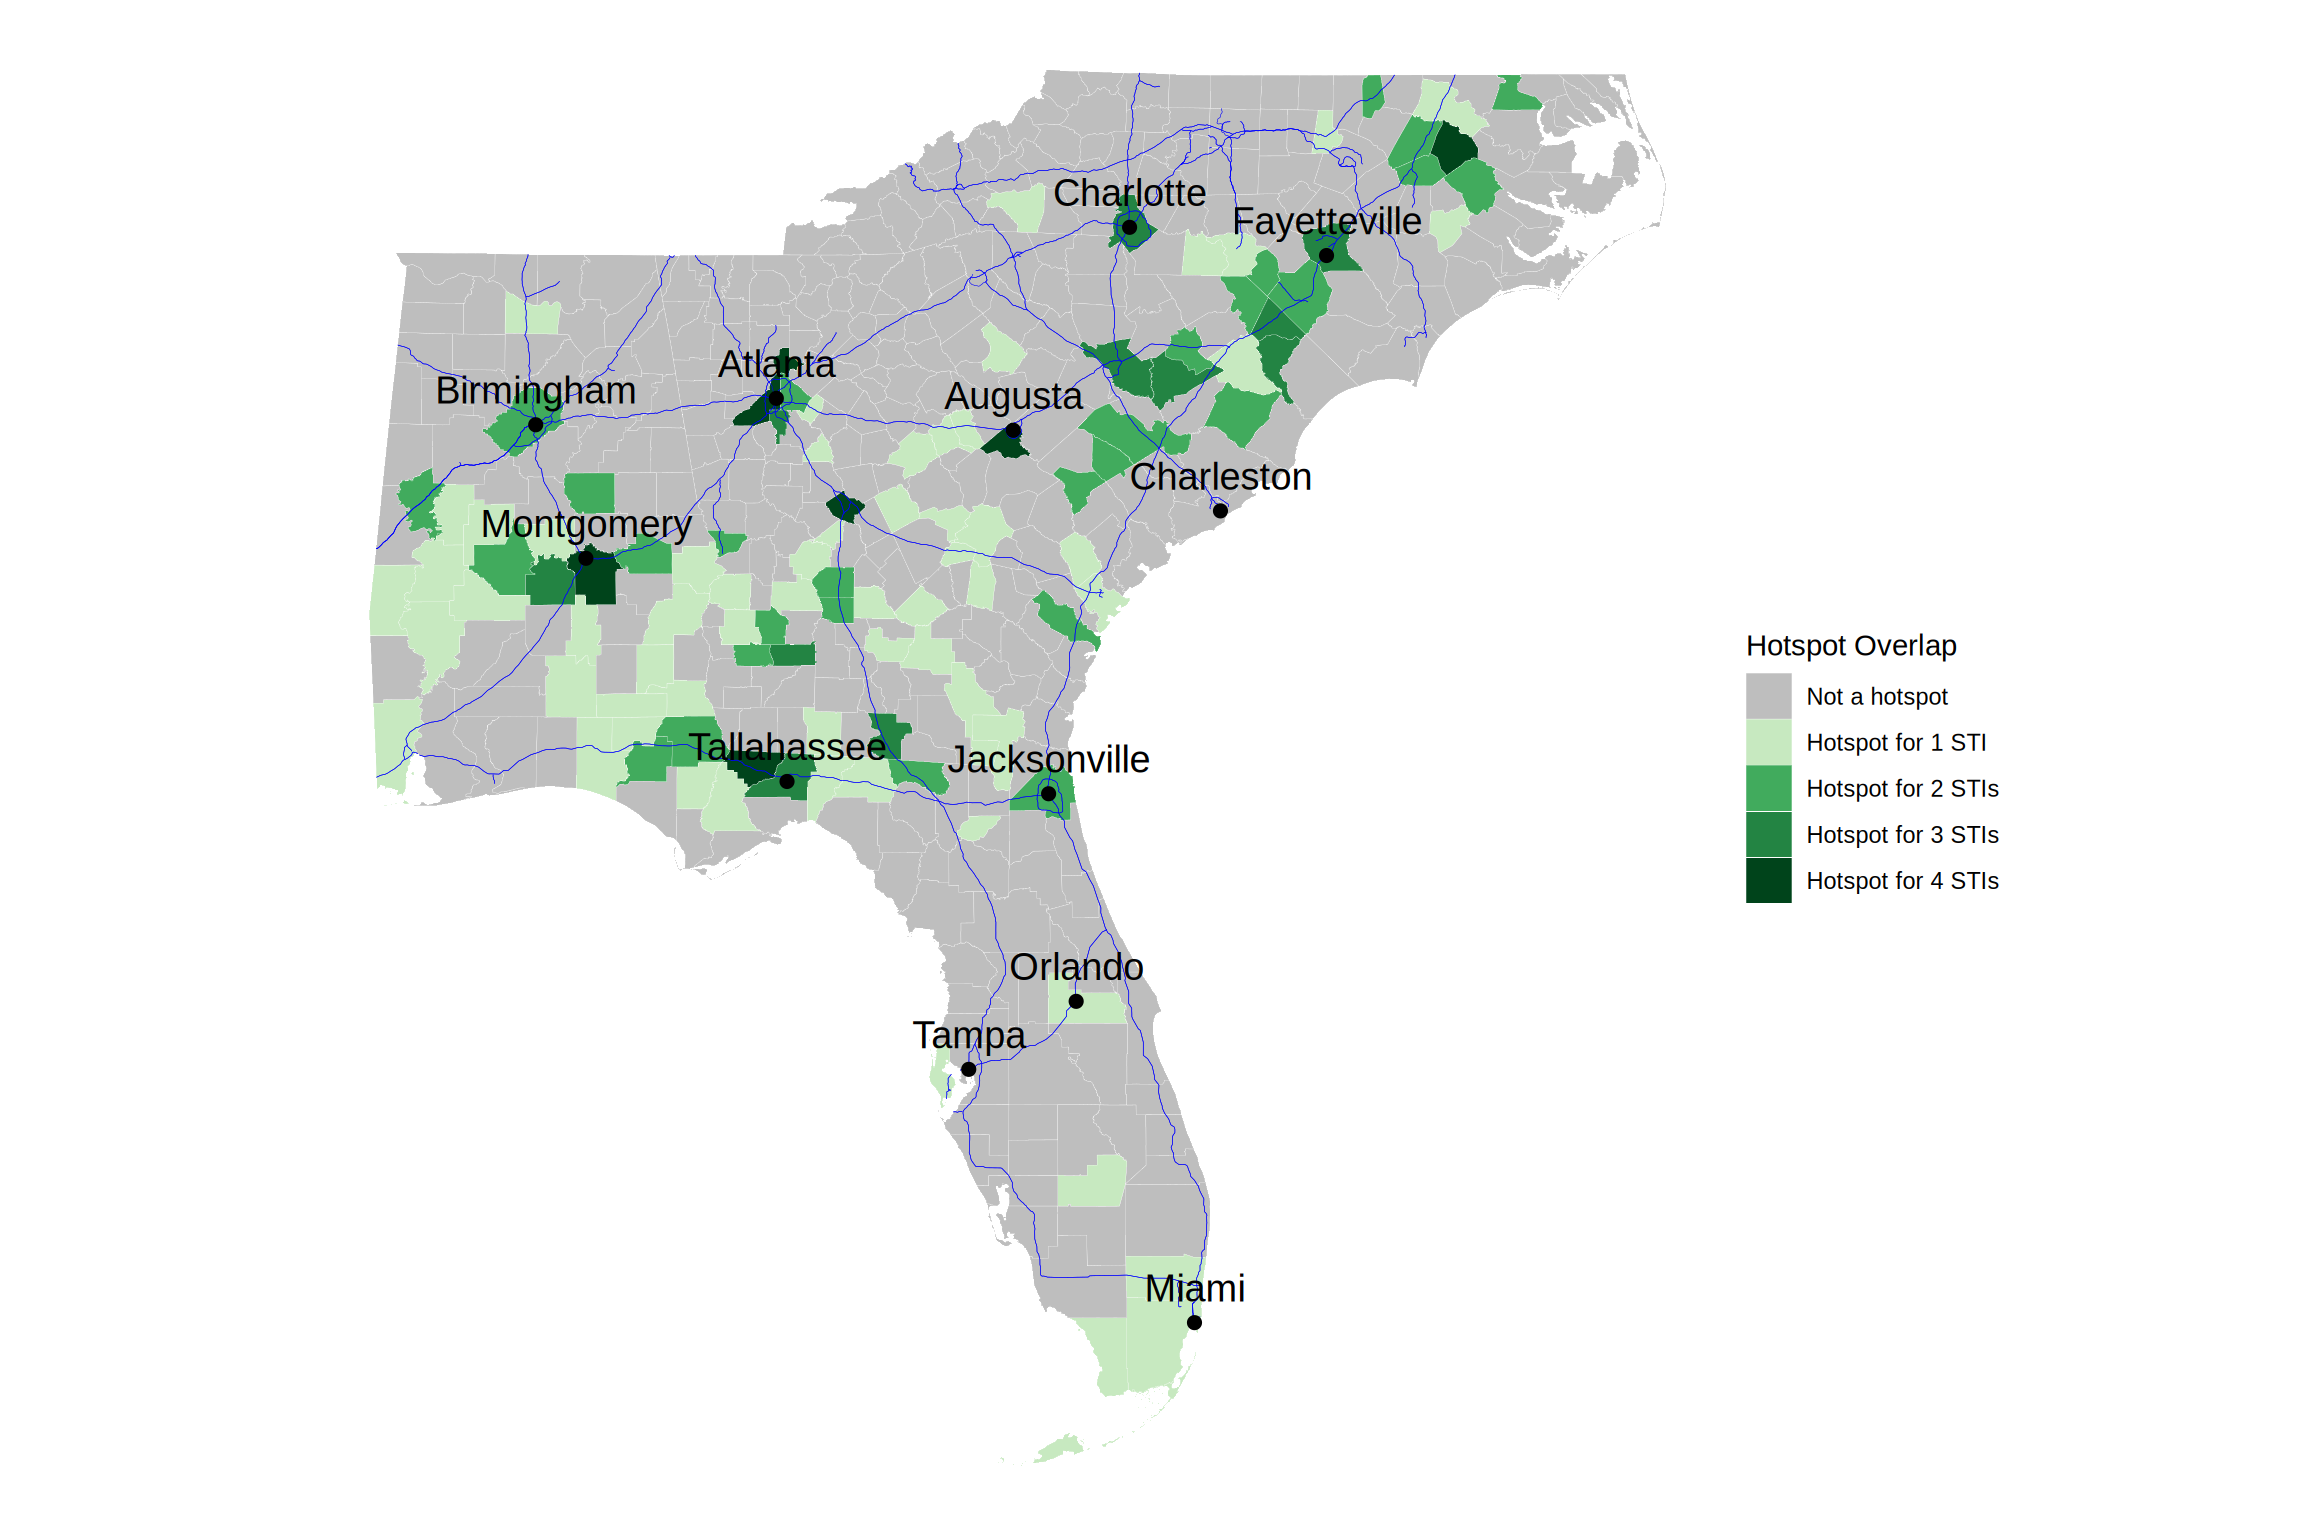
Overlap of spatial hotspots
In the below map, we examine the overlap of spatial hotspots for each sexually transmitted infection. We see that there is a moderate amount of overlap, with some counties being hotspots for multiple diseases. This could suggest that there are shared risk factors or transmission networks across these diseases.
Major interstate highways are shown in blue.