Primary and Secondary Syphilis Growth Rates Over Time
Growth Rates by County
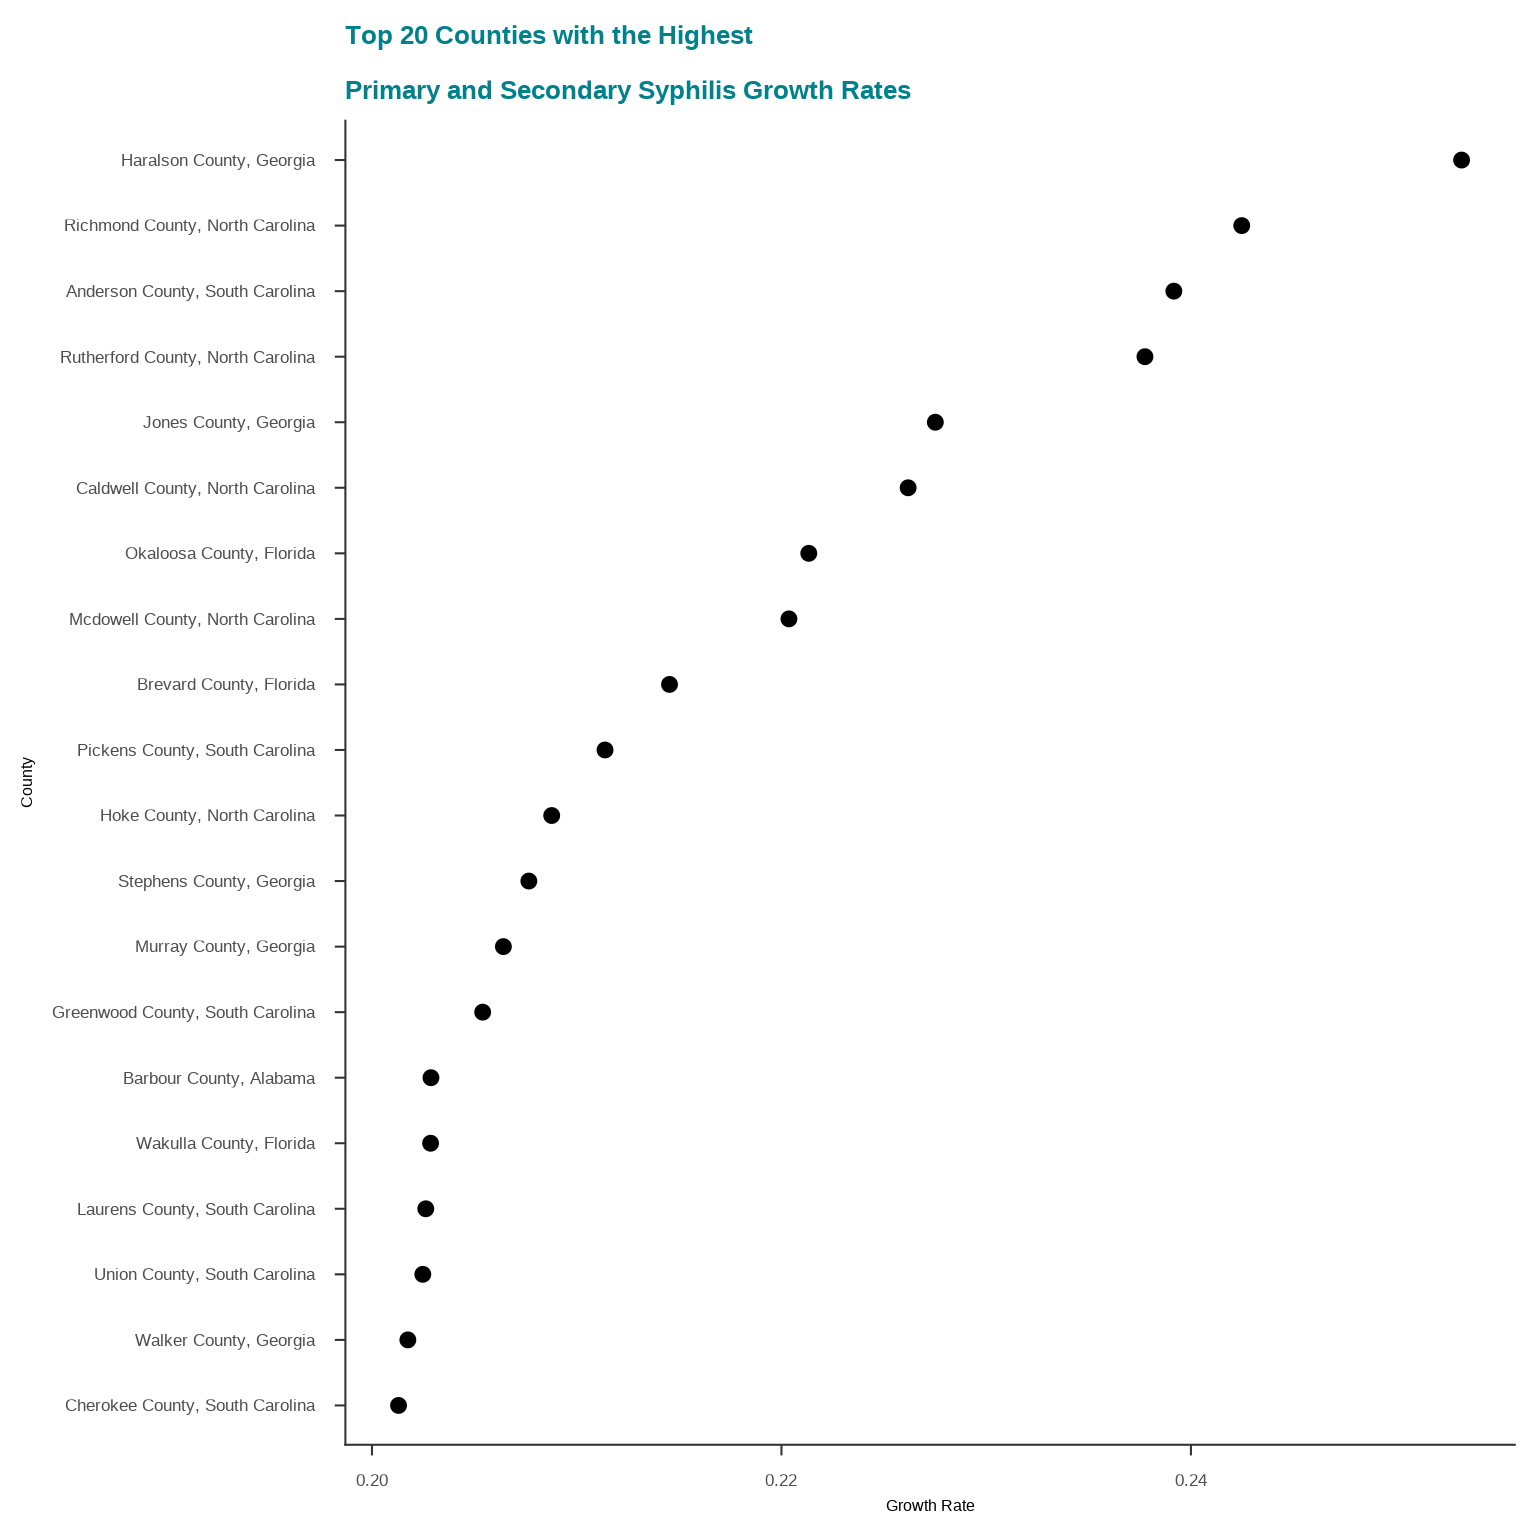
Where are the counties with the highest growth rates located?
To answer this question we fit a Bayesian growth curve model to the data and extract the county-specific year coefficients. Random effects are included for each county to account for county-specific variation in growth rates.
We can also examine this on the map
See how these growth rates compare to the number of Syphilis testing locations in each county.